I've been working on some Taito Chase H.Q. PCB repairs and the subject has turned to using analog Cathode Ray Oscilloscopes (CROs) for fault tracing. With far more powerful digital storage devices now available it seems to be a common misconception that analog scopes are useless against faults in digital circuits so I'm hoping to debunk that myth and share a few tips and tricks along the way.
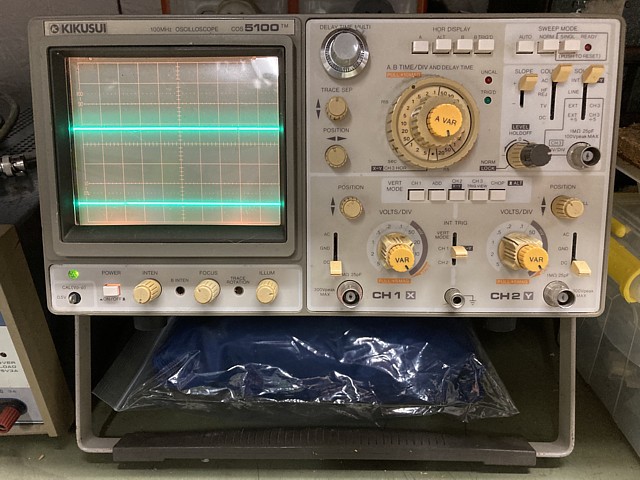
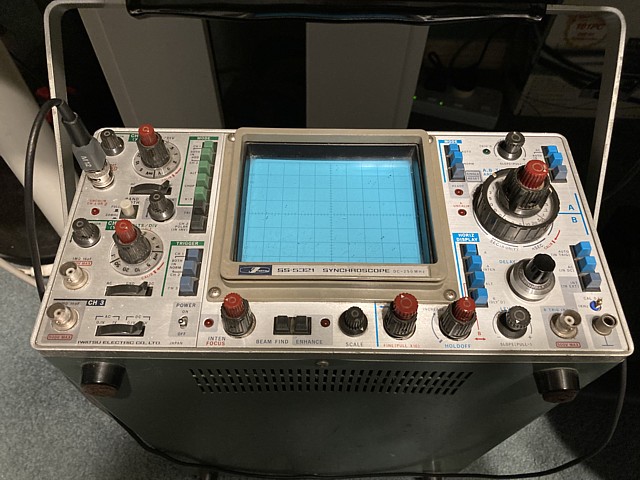
I'll try and keep this topic on test methods but use the Chase H.Q. PCB as our test subject for the moment. For anyone who isn't familiar with these units I'll begin by trying to summarise the controls.
Most CROs have fairly standardised controls, beginning with display intensity, focus and scale illumination. The intensity will vary a great deal with changing sweep rates and triggering frequency so will often need to be adjusted along the way. The trace(s) only need to be bright enough to see clearly in the given light conditions, too bright and the beam will flare, the focus control will be unable to sharpen the image.
Next the Horizontal display mode; these CROs pictured both have a dual timebase and delay triggers - meaning they can setup a trace of a regular trigger event then 'zoom in' on a small portion of that trace by using a variable delay and a higher sweep rate to display a small section of the original trace in greater detail. To begin with we'll just use the main, A timebase and set this control to 'A'
The Horizontal Position control shifts the traces horizontally on the display and can be used to centre the trace so neither side appears cut off and to vary the fine position of a waveform to align it with the graticule, useful for comparison of timing between two signals.
Channels
The channel mode switch sets the display to a single channel, 1 or 2, dual trace mode or 'add' which displays the sum of the two inputs. By using the invert switch on Ch. 2 we can also see the difference between the two inputs. Both functions can be quite useful for digital signals, not only analog for example if we have two signals entering an AND gate and we can't easily tell if they are ever both high at the same time we can 'add' them. The display will show a higher Voltage when both signals are simultaneously high.
In dual channel mode the display will either 'alternate' or 'chop' between the two traces. in 'chop' mode the relative timing between the two signals is more relevant, both traces being drawn in a single sweep but at higher sweep rates the switching between traces can obscure some of the signal displayed so the most suitable choice is determined by the type of measurement. To begin with we'll start with just one channel and set the mode switch to Ch. 1.
Trigger
By this stage if there isn't already a trace on the screen it could be there is no relevant signal to trigger a sweep. Common trigger modes are Auto, Normal and Single. In 'Normal' mode there will be no horizontal trace unless the trigger conditions are met. In 'Single' mode only one sweep will occur when triggered, until manually reset. In 'Auto' mode the horizontal sweep will free run at the selected 'time per division' rate if the trigger conditions are not met.
In 'Auto' mode the CRO displays continuously, although the waveform may roll across the screen until the trigger is correctly set there is an instant indication of signal presence and Voltage range. For most troubleshooting work this is my preferred setup so we'll begin with the trigger mode set to 'Auto'
The signal source for the trigger circuit can be selected from Channel 1 or 2, an additional (external) input signal or 'line' which will trigger the CRO in sync with the AC mains - useful for looking at hum in linear power supplies for example. To begin with we'll set our trigger source to Ch.1
There are also different types of coupling or filtering for the trigger signal; AC or DC coupled, HF reject which reduces the high frequency sensitivity to allow triggering on low frequency content within the trigger signal and some CROs also have a specific TV trigger mode which triggers on either the horizontal or vertical sync frequency depending on the sweep rate selected. If there is no 'TV' trigger mode, the HF reject selection will allow the trigger circuit to reject the higher frequency horizontal sync and trigger on the vertical sync component in a composite sync signal.
Finally, there is usually a trigger slope switch which will cause the trigger circuit to detect either a positive or negative transition. In the case of something like a composite video signal which is not symmetrical, has a varying average Voltage as well as a negative going sync signal a DC coupled negative slope trigger should be the most effective. For now though we'll leave it set to the 'default' AC, positive slope settings.
Timebase
The sweep rate which I've already mentioned is set by the larger knob, being the A timebase Time per Division control. By increasing or decreasing the speed of the horizontal sweep higher or lower frequency signals can be displayed and their period measured in milliseconds, microseconds or even nanoseconds for higher bandwidth oscilloscopes. In X-Y mode the display does not sweep horizontally, rather is driven in both X and Y axes by the external input signals as well as intensity which can be determined by an external signal applied to the Z axis input, often found on the rear panel of the CRO, if present.
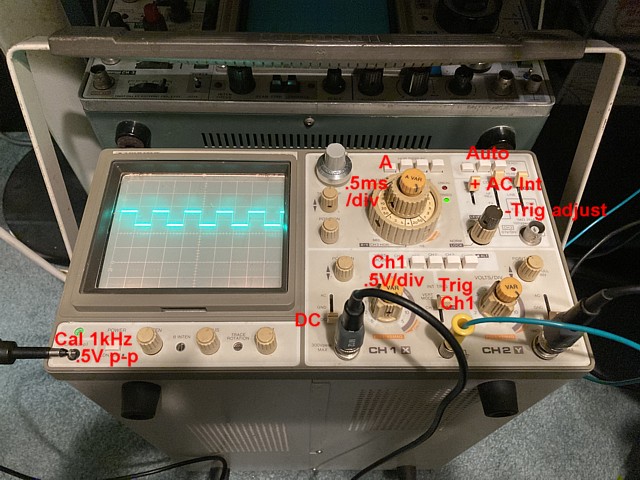
For starters we'll set our sweep rate to 0.5 milliseconds per division to view the CRO's internal test / calibration signal. So to recap our CRO would initially be set for 'A' timebase, Ch. 1 input, Auto trigger on Ch.1, AC, positive slope, 0.5 milliseconds per division.
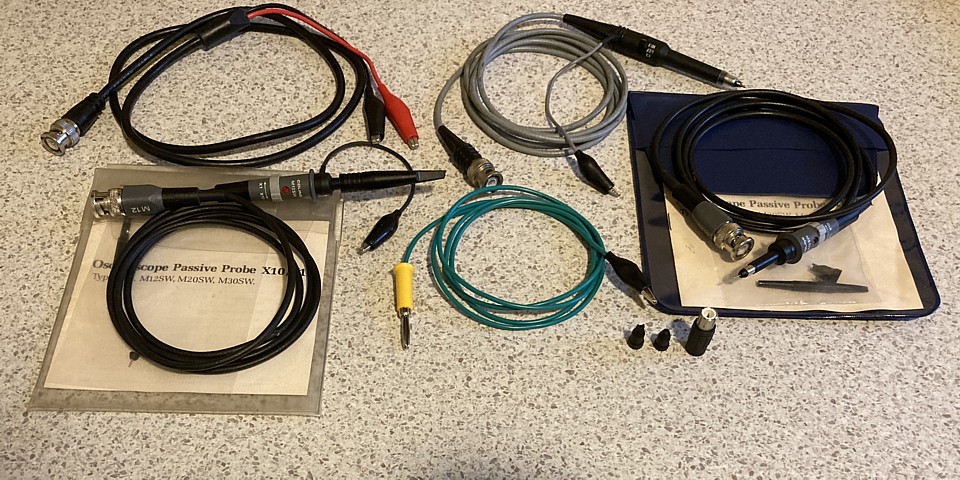
Probes
Inputs to the Oscilloscope are usually via BNC connectors. For PCB troubleshooting a purpose made probe with fine tip and a removable clip for attaching to test points is ideal. Such probes are often '10x' or have a switch to select between 1x and 10x operation. A 10x probe actually divides the connected signal by 10 (so the measured signal is 10 times larger than indicated by the input range selected on the CRO).
Some Tektronix models (and probably others), have a feature where the input range selected is indicated by an illuminated segment on the dial which changes when a compatible 10x probe is connected, automatically indicating the correct Voltage range. For most other models it is necessary to remember that with a 10x probe a voltage measured will be 10 times greater than indicated. For example to view a 5V logic signal with a height of 1 division on screen the 0.5V per division Voltage range would be used.
For 10x operation there is also usually a frequency compensation trimmer on the probe or plug body which can be adjusted using the CRO's internal test / calibration signal which we'll cover soon.
Signal ground
In order to correctly display a signal the input ground of the CRO needs to be connected to the 0V circuit ground of the device under test. To keep stray or unwanted 'noise' signals to a minimum a very short earth link from the ground at the probe can be connected to circuit ground at some close point to the signal being tested. While this is ideal in theory it is often difficult to find a nearby ground point which the short ground lead can securely connect to. If the ground clip is not secure and slips off the ground point in use it can actually short out some other point on the PCB under test.
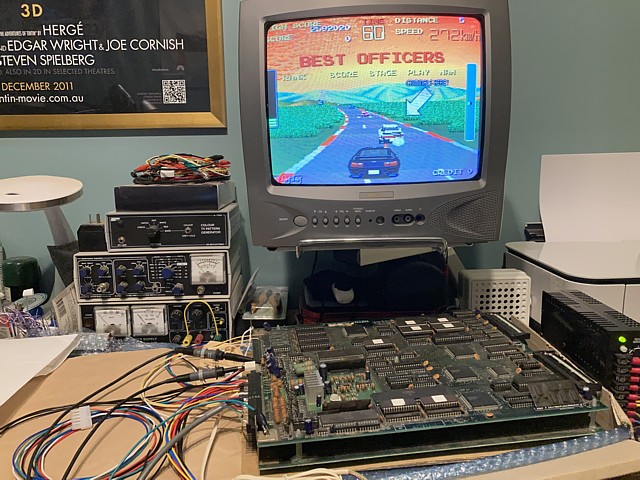
To avoid the need to relocate the short earth lead and clip every time a new point on the PCB is tested, I prefer instead to use a longer earth lead directly from the CRO front panel ground point to the circuit ground (0V) on the PCB under test (see the green wire in picture above) and remove the short ground lead from the probe.
Although some additional noise may be picked up by the longer ground lead the risk of accidentally causing a short to the PCB is reduced as well as the time wasted finding a new ground point whenever a different part of the PCB is to be tested.
Cal / Test signal
Most CROs will also have a small test point on the front panel, useful for checking the basic functions of the equipment as well as the probes and also for setting the high frequency compensation in the case of 10x probes. It is usually a 1kHz square wave and on this unit the level is 0.6V p-p. As I'm using a probe set to 10x ratio I'll set the Channel 1 Voltage range to 50mV per division.
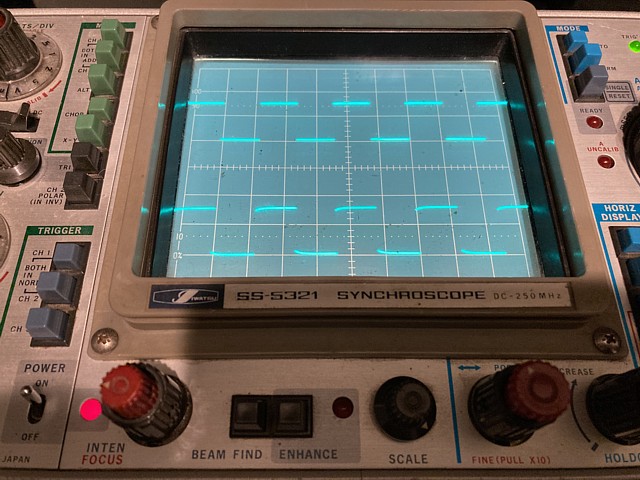
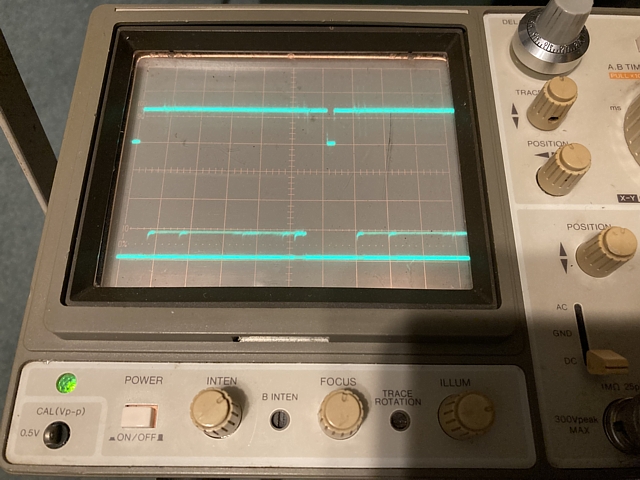
Initially setting the input coupling switch to ground and adjusting the vertical position to line up with the graticule (one line above centre in this case), then switching to DC coupling and adjusting the trigger level for a stable display we should see our test signal like so:
At 1kHz a full cycle of our square wave test signal will take 1 millisecond - at 0.5 ms / div that should repeat every 2 divisions on screen and we can see some miscalibration either in our timebase or the test signal itself. Likewise our Voltage scale is reading just over 7 minor divisions rather than 6 as expected. In a laboratory situation this would be well outside tolerance and the CRO long overdue for recalibration but for troubleshooting work the exact readings are not so critical.
Usually any logic level signals are simply compared with our supply and ground Voltages, which are set with a digital multimeter. Likewise any exact frequency measurements should normally be taken with a frequency counter rather than derived from the CRO display. Connecting a second probe now and switching to dual channel mode the second probe requires a slight adjustment to its frequency compensation to correct the rounded appearance of our square wave. These simple checks should be made regularly and can be done to verify the correct operation of the equipment if any test measurements seem incorrect.
So, having set up and checked our CRO it's time to view some actual signals from our PCB on the bench, beginning with our RGB video sync signal. We'll connect our ground lead to the PCB ground and our Ch.1 probe to the composite sync output at C128. We'll also connect the Ch. 2 probe to the Red output signal, in this case at the video connector itself.
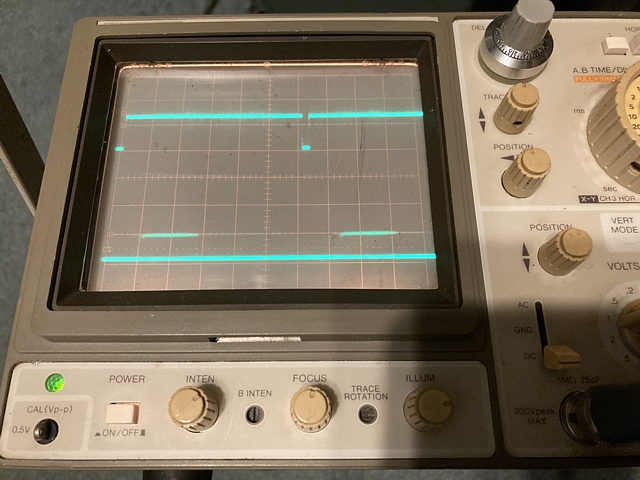
Initially looking at Ch. 1 only, at 0.1V / div (10x) and our timebase at 10 microseconds per division, trigger set to DC, negative slope and adjusting our trigger level to show a stable image we can see the horizontal sync signal at the start of our trace, repeating towards the right of screen. This represents one line interval of approximately 60 microseconds.
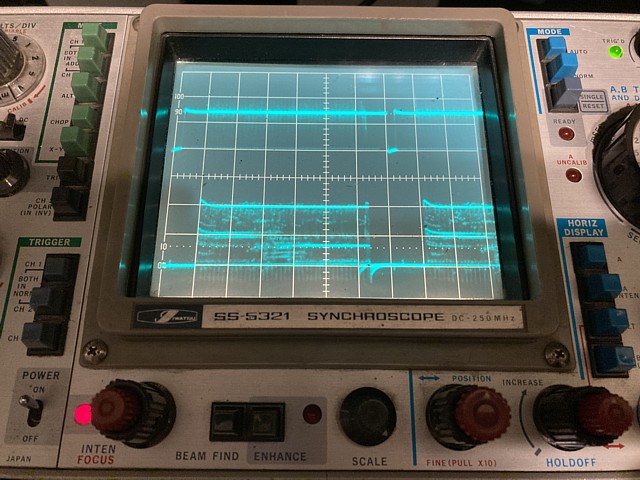
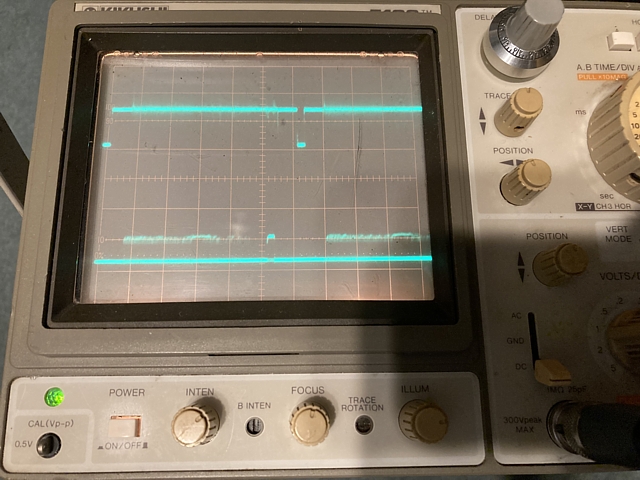
Switching to dual channel, chop in this instance we can see the red component of the video signal on Ch. 2 at 0.2V per division, DC coupled. This represents one line interval but the display is actually showing every line superimposed rather than one single line of video. To display one single line will require the dual timebase and delay trigger. Being a display of the video lines, the information seen on the display represents the (red) video from left to right of screen and the horizontal blanking period before and after horizontal sync can also be observed.
Now changing our trigger mode to HF reject and our horizontal scan rate to 2 milliseconds per division, readjusting our trigger level to obtain a stable display we can see the vertical interval with the vertical sync to the left of display and again near the right. We can also see the horizontal sync pulses inbetween, faintly but in this setup those are ignored by our trigger due to the HF reject setting.
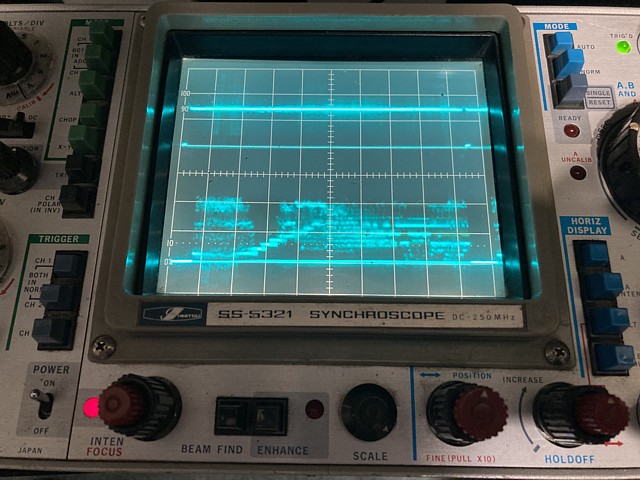
Our Ch. 2 display now shows a frame of (red) video and every line from top of screen (left of display) to bottom of screen (right of display) with vertical blanking period either side of vertical sync, These trigger setups are useful for tracing faults which show up in fixed locations on screen. The settings mentioned so far would equally apply to just about any 'standard resolution' game with RGB and composite sync output.
Hoping this may help others to get more from their old, analog CRO. Stay tuned for more advanced measurements to come.
Last week I raised the subject of using analog Cathode Ray Oscilloscopes (CROs) for fault tracing in digital circuits, beginning with a summary of the controls before viewing some actual signals from our PCB on the bench.
Setting the oscilloscope to correctly display a particular signal can be quite complex and I may have glossed over a few of the details so I'll try to address that and recap.
First some background information:-
Horizontal / Vertical period.
Most 'standard resolution' arcade games follow the U.S. / Japan (NTSC) 60Hz video standard.
The actual frequencies do vary a little from one game to another as the signals are not broadcast quality and were never intended to be transmitted or recorded.
To display correctly on an RGB arcade monitor the Horizontal frequency is approx. 15.7kHz and the Vertical frequency 60 Hz approx.
( Unlike Television standard signals arcade video is usually non-interlaced so I won't mention the difference between field rate and frame rate. )
So the time period for each line of video is just over 60 microseconds and each vertical 'frame' about 16 milliseconds.
There are 10 divisions on most CRO displays from left to right so to display a full horizontal line period on our oscilloscope we will use the 10 microseconds per division range.
- and to see the full video frame from one Vertical interval to the next we will use 2 milliseconds per division.
Trigger / Sync
The most critical factor in obtaining a meaningful waveform on our CRO display is the trigger circuit. The trigger point for a CRO is not unlike sync to a video monitor - without it the information contained within the signal will roll past, any patterns will not be recognisable.
For a data signal a trigger source may be a clock or timing signal, select or strobe line or just the rising or falling edge of the signal itself to view the overall signal quality rather than a specific event.
Towards the output end of our arcade game PCB, the data which is read out and makes up our video information will be in time with our video sync signal so that makes an ideal trigger source.
To look at some detail which occurs at the same point on successive lines we would trigger on our horizontal sync or to view some issue at a specific point from top to bottom of screen (or within the vertical interval) we might trigger on the vertical sync signal.
Now to try our original setups once again, in a little more detail - this time I'll swap my trusty original CRO for a recent addition which I haven't used before in this type of situation. It's probably a similar age to the arcade PCB we're working on. This one has 100 MHz bandwidth compared to my original CROs 250MHz but even 50MHz should be sufficient for this type of measurement.
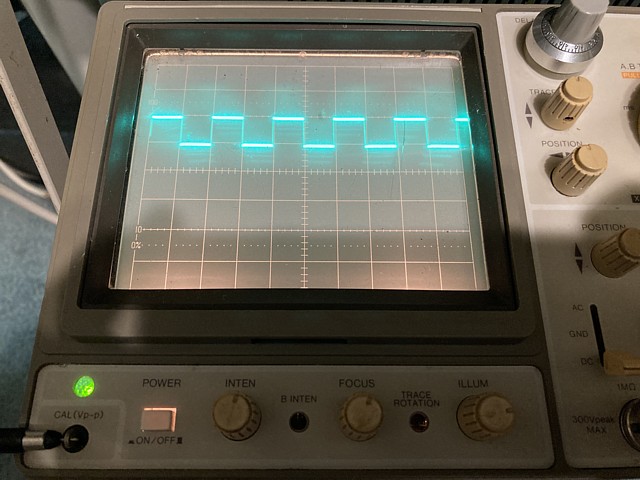
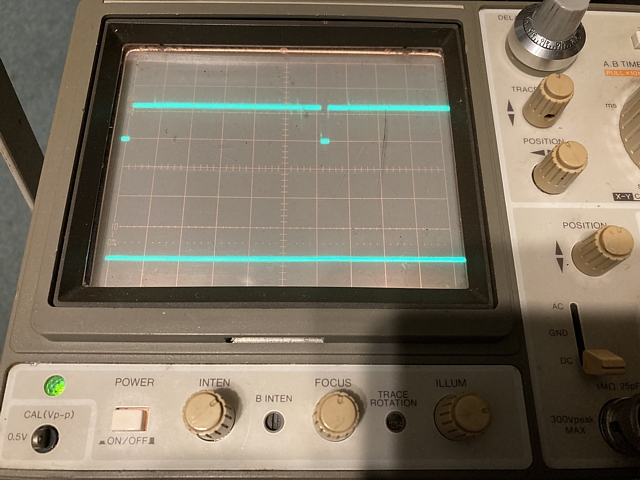
We'll begin once again with the Cal / Test signal just to make sure the Voltage and timebase settings we're selecting display as expected. On this machine the test signal is 1kHz again, this time at 0.5V p-p so we'll set the controls as below:
And the resulting waveform looks perfect, following the markings on the graticule exactly. Gotta be happy with that!
Edit: if the probe is set to 10x our Voltage range would need to be 50mV per division. (0.5V / div for 1x probe)
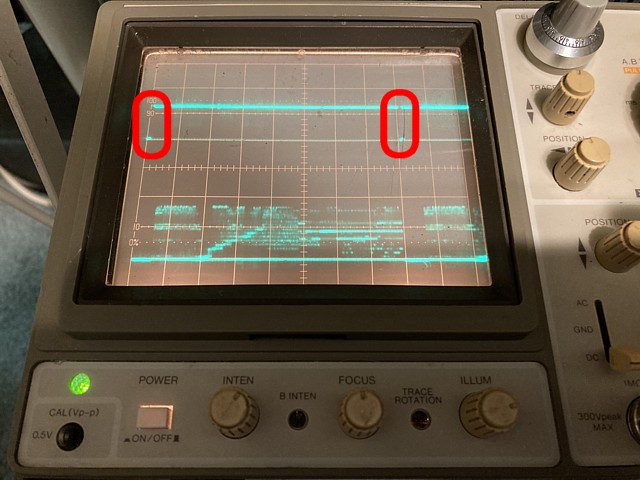
So in our first setup we want to look at video lines and we need our CRO to trigger on the horizontal sync , display a complete line to the next horizontal sync. It will then retrigger on the next horizontal sync after that, effectively displaying every second line of video superimposed.
Timebase 10 microseconds per division. Trigger set to Ch. 1, DC or TV, negative slope Ch.1 Voltage range 0.1 V / div (10x) or 1V / div (1x). Adjust the trigger level to obtain a stable display showing horizontal syncs as below. Adjust horizontal position if required to show the first sync pulse at the start of the trace.
Once the sync pulses are displayed as above and the trigger level set so they are stable and not jumping it should be possible to look at video lines, setting the display to dual channel, Ch.2 Voltage range here is 0.2V / div (10x) and the Ch2 probe connected to our PCBs red output signal.
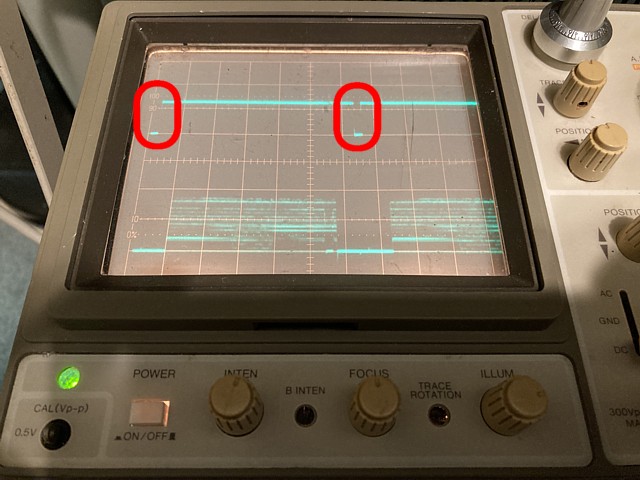
Moving on to the second setup, we're attempting to trigger only on the Vertical sync and display complete video frames so our timebase will be much slower than the previous setup.
Timebase 2 milliseconds per division. Trigger set to Ch. 1, 'HF Reject' or TV, negative slope Ch.1 Voltage range 0.1 V / div (10x) or 1V / div (1x). Adjust the trigger level to obtain a stable display showing vertical syncs as below. Adjust horizontal position if required to show the first Vsync pulse at the start of the trace.
Although the vertical sync pulses above seem narrower than our horizontal sync in the previous photo they're actually longer but we're using a much slower timebase to display them. The horizontal syncs now appear just as faint dots inbetween the two vertical sync pulses in our Ch.1 trace.
Once the Vertical sync pulses can be seen as above, with dual channel selected and Ch. 2 probe conected to the PCB red output the trace will show a full video frame with information at the top of screen seen to the left of trace and details from the bottom of the video image towards the right of the CRO trace.
Having mastered those controls, next time we'll try to expand upon that and view the digital video data in the output section of the game's video PCB, attempt to identify any issues contributing to artifacts seen on the video image.
As a follow up to my previous entry about the CRO timebase and triggering I'll attempt to demonstrate the TV trigger mode found on some oscilloscopes. It's easy to confuse the Horizontal and Vertical timebases of a video signal with the horizontal and vertical axes of our oscilloscope display but those terms are quite different.
For the oscilloscope the horizontal (x axis) represents 'time' and selecting the sweep rate sets the scale of time per division from seconds to microseconds. And the vertical (y axis) represents Voltage so the CRO display is a graph of the instantaneous Voltage Vs. time or signal vs. time.
At slower sweep rates we can see details in our signal which have a lower frequency or repetition rate. Turning our horizontal sweep knob clockwise increases our sweep rate and displays a smaller time per division, revealing details which have a higher frequency or repetition rate.
At any sweep rate, to see the signal clearly without 'rolling' we need a trigger point, either within the signal itself or another timing reference with the same repetition rate as the details we are trying to view. So the TV trigger mode applies specifically to TV / video signals and is included in some CROs as TV / video servicing would be one of the most common applications for a CRO.
Video signals are quite complex as there are two simultaneous timebases contained within the video signal, Horizontal and Vertical (not the same as the horizontal and vertical axes on our CRO) - even more complex in the case of composite colour signals for television but we will stick to monochrome or RGB signals as used in arcade machines...
As we know the raster image displayed on most arcade screens is built up line by line, the 'horizontal' line rate is around 15.7kHz so repeats about every 64 microseconds. About 262 lines are traced out by the monitor ( a few near the top and bottom of screen are blank ) then a vertical retrace must be triggered and the process repeats, from the top. This takes about 16 milliseconds resulting in a 'frame rate' around 60Hz.
Of course the video signal does alter from line to line and from each frame to the next as it is a moving image but in many cases there are common elements which repeat in the same position each line or each frame. A lot of fault conditions also occur in a fixed location on the display so being able to trace these errors back to their source is the point in question.
I'll try to illustrate the Hsync / Vsync triggering, using a basic TV test pattern; Here I've just connected a monochrome, composite grey scale test pattern to the test bench monitor.
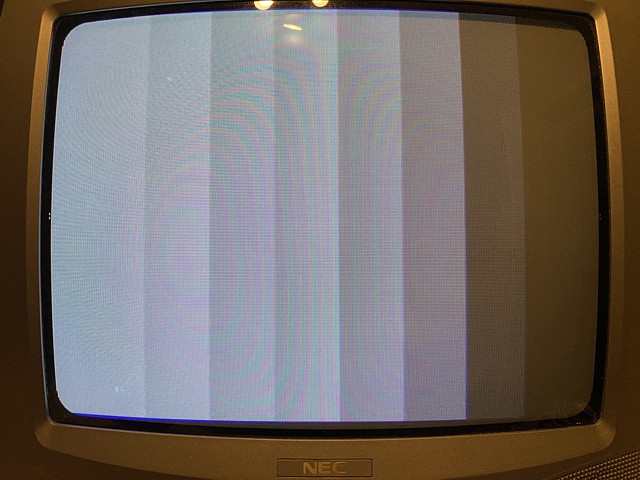
As we can see, each line is the same and consists of a pattern which steps down from white to black in 8 steps.
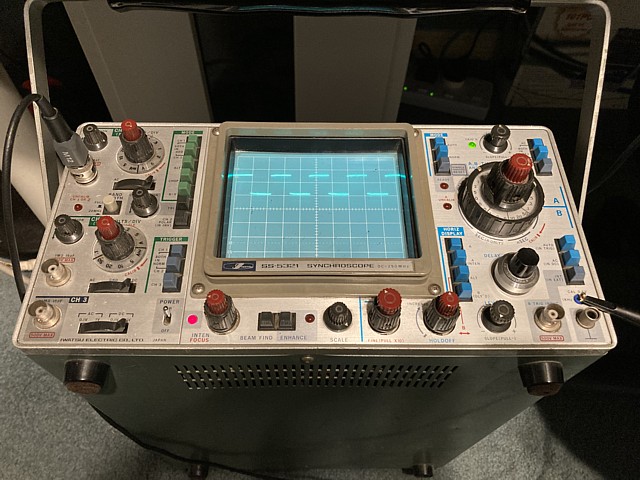
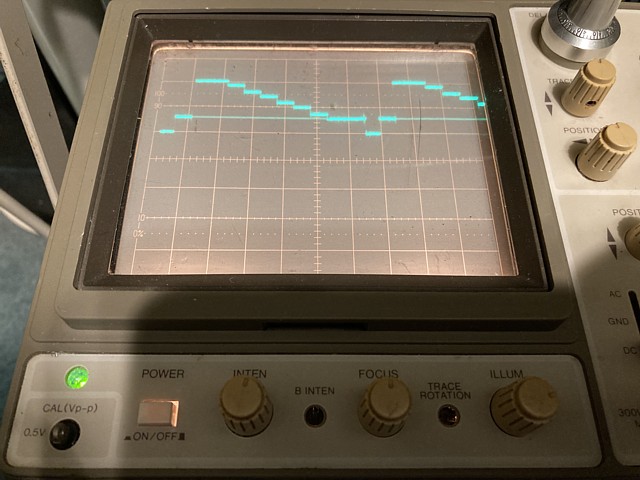
Using our TV trigger, at 10 microseconds per division we can see the CRO locks onto our Hsync and displays the contents of each line. Even though the display is showing multiple lines superimposed the image is clear as every line is the same. This is composite video so the levels we can see are: sync 0V, black 0.3V, white 1.0V grey inbetween 0.3 and 1.0V.
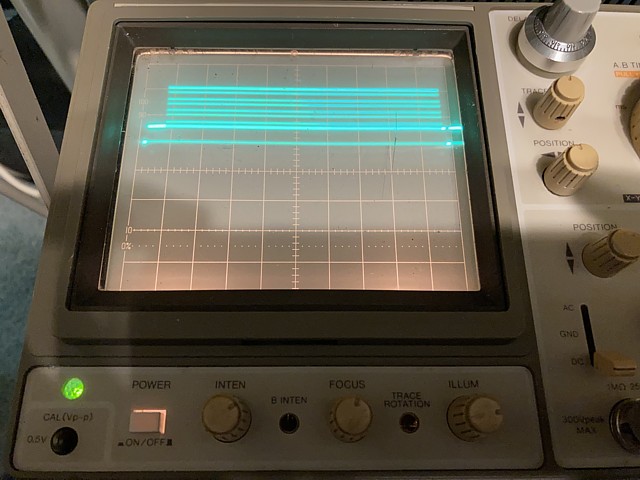
Using the same signal but changing our sweep rate to 2 milliseconds per division and adjusting the trigger level until the display is stable we can see the CRO now just triggers on the Vsync which is the brighter patch on the 0V line at the left and right of display. The faint trace between those is made up by the horizontal sync pulses.
We can now see a full frame of video beginning with Vsync, a few blank lines then all of our 'horizontal' lines until the couple of blank lines at the end of frame and the next Vsync repeats the cycle.
Although the pattern above just looks like continuous Voltage levels we can expand that display using our 'x10 MAG' button and see the individual sync pulses and lines of video. The x10 MAG control just causes the horizontal sweep to overscan and we can use the horizontal position control to scroll along from the beginning to end in more detail.
- It should normally be OFF and just used to zoom in on a trace for more detail. We can zoom in even further using our second timebase and delay trigger but that is a more advanced topic.
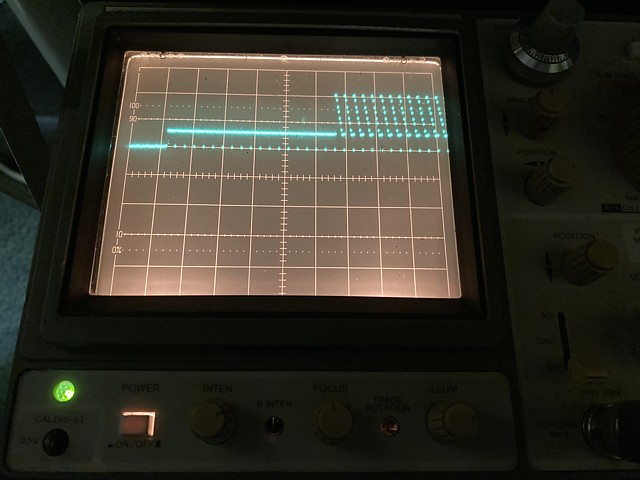
So having expanded our previous image we can see the longer Vsync pulse followed by some blank lines then some of our active lines showing the grey scale from white to black and horizontal sync pulses inbetween each line. (I've turned off the room light to see this a little clearer in the photo)
- All of the images here are displaying the same signal, just looking at different features; within a line, the overall frame and showing part of a frame in greater detail. Hopefully that may help to clarify the CRO timebase and triggring on specific time scales within a complex signal.
OK, we've done some basic setup and triggering excercises with our CROs and it's time to try a few measurements on our actual game PCBs, hopefully identify a fault condition and possibly trace it to its source.
We've looked briefly at the final analog video output from the CPU PCB, this is built up from multiple layers of graphic components, scrolling backgrounds, text and large sprites. The sprites include the cars, some scenery such as trees and tunnels as well as animated title graphics and originate from the video PCB.
At that stage the graphics are in digital form so instead of comprising three analog signals representing R,G and B components there are 13 bits of data, I'm assuming 4 bits per colour and 1 bit which may be a key signal, to determine the outline of the sprite which will be superimposed over the background layers.
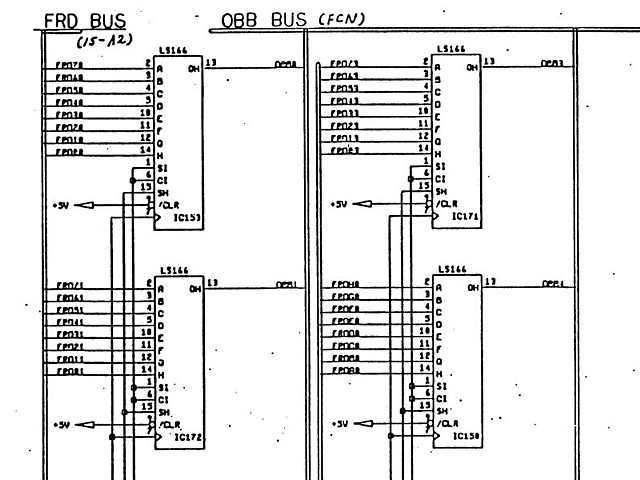
We can begin at the point where the sprite graphics leave the video PCB and are sent to the CPU PCB over the 'F' interconnecting cable, working back from that point. The final stage is a bank of 13, 74LS166 8 into 1 bit shift registers . Each takes a byte of data at a time, shifting that out bit by bit. Each group of 13 bits at the output of these shift registers would represent one pixel of a sprite graphic. The outputs are only active when there are sprites to appear on screen.
Referring to the Chase HQ Schematic the bank of 13 x 74LS166 shift registers are shown. Each takes a byte of data at a time from the FRD bus (I assume that refers to frame data) and outputs bit by bit to the OBB bus ( objects?) which goes to the CPU PCB via the 'F' ribbon cable (FCN). A small excerpt of the diagram shows the ins and outs...
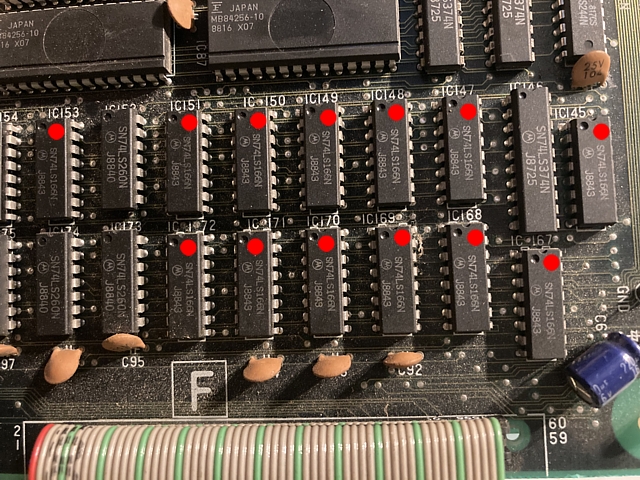
And we can see the 13 ICs in question on the video PCB here:
The main difference between using a logic probe to test signals on a circuit and an oscilloscope is the logic probe can only tell us if signals are present and active but not whether they are complete or relevant to the intended function. To give the signals we are viewing some meaning we need to set up our oscilloscope to trigger and view the signal in context to the overall process.
So as trivial as it may seem, the most important stage is to set up the trigger. With experience we can just look at a signal then set up a trigger to get a clear picture but to demonstrate more clearly we'll do the trigger first using a setup we've already practiced, looking at video lines.
We'll use our composite sync as our trigger source and we'll keep it visible on our display to use as a reference so select dual channel mode. I usually put channel 1 in the top half of display and channel 2 in the bottom half. At 10 microseconds per division with channel 1 as our trigger source and using TV trigger (or DC trigger if there is no TV setting) negative slope and adjusting our trigger level so the horizontal syncs are steady and not jumping around.
We can use the horizontal position control to see the initial trigger point and one complete line period to the next horizontal sync. If we've set it up correctly the second sync should appear just over 6 divisions after the first (64 microseconds or 6.4 divisions at 10 usec / div.)
Once that is set up and stable we can look at the data at the output of each shift register, pin 13 using our second channel. The data is TTL level so we can set our Ch. 2 gain to 5V per division (or 0.5V per division using a 10x probe)
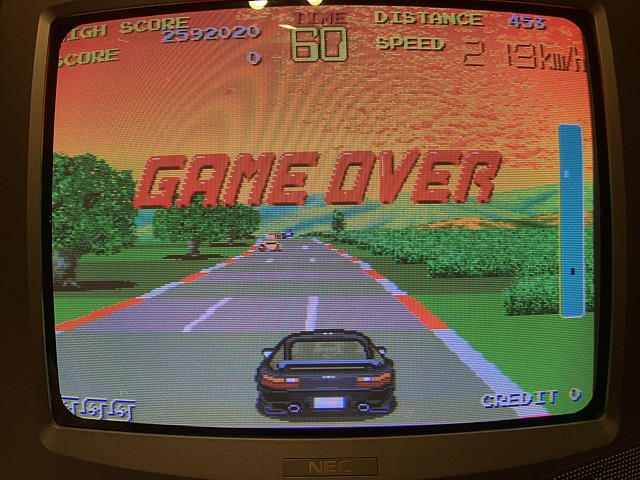
We'll just leave the attract mode running on our game, as below. As the scene changes sprites appear and move around. At some points there are no sprites on screen for example the game instructions which tell us to 'bumb' into the 'climinals' are on a scrolling background layer so we just wait until there are sprites on screen to check each shift register output.
As long as we keep our trigger signal on Ch.1 steady the output of the shift registers should be active, depending on the sprite activity, during the active video line period. The intensity will seem to vary as the lower order bits may toggle very often and high order bits may seem more solid on the display but all 13 should have activity at various times.
The images here are all from a working PCB. In the image below the chase car sprite is on screen towards the left. As the attract mode continues other sprites also appear and move around. The main problems we are looking for are dropouts where some positions across the line are always missing, or incorrect data levels.
Another image below where the sprites are mainly situated towards the left of screen. The blip towards the right of the active line, just before the next horizontal sync is the blue 'progress bar' which can be seen on the monitor image above showing the distance from the chase car to the target.
So all of the images above are OK but if a video board has an issue where sections of a sprite are missing or lines which look like 'jail bars' appear at regular intervals on the sprites these may be visible on one (or more) of the shift register outputs. and can be traced further back.
Anyway I hope that helps to illustrate one potential method for locating a graphics fault, starting at the irregular output and working back from there.
As always when fault tracing, take your time and take care not to short adjacent pins when probing IC legs etc.
To be continued...
All images and text on this website are Copyright.
Contact: jbtech at telstra dot com